Are Philippine lotto outlets concentrated in poorer or richer neighborhoods?
Lotto outlets follow commerce, not poverty. In Metro Manila, access is more equal.
Lotto outlets are concentrated in richer areas, not poorer ones. Richer places have more and closer outlets nationally, but that gap mostly reflects where commerce is. But, in Metro Manila, that gap disappears: everyone lives near a lotto outlet and the lotto outlets per person are evenly distributed across wealth quintiles.
The lottery is often dubbed as "a tax on the poor" since poorer households spend a far bigger share of their income on lotto tickets than richer ones; Johnny Harris's video The US Lottery is a Lie makes that case for the US.
There are two ways to test this: access and spend. This study focuses on access: are Philippine lotto outlets concentrated in poorer or richer neighbourhoods? Spend, whether poorer households spend more on tickets, needs household budget data and is out of scope.
MAP /
Outlets per person, tile by tile
Every 2.4 km wealth tile in the country, with the barangays of Metro Manila, Metro Cebu and Metro Davao drawn on top. Switch between the outlet rate, the Relative Wealth Index, the two together and the count model's residual hot spots, and hover for any place's numbers.
Counts only: PCSO's outlet list carries owners' names, so outlet points are never published.Open the map full screen
THREE KEY INSIGHTS /
What the data say
Wealth comes from Meta's Relative Wealth Index (RWI). Each wealth quintile holds the same number of people, from Q1, the poorest, to Q5, the richest.
01 / THE COUNTRY
Nationally, richer places have more lotto outlets per person, and the people there live closer to one
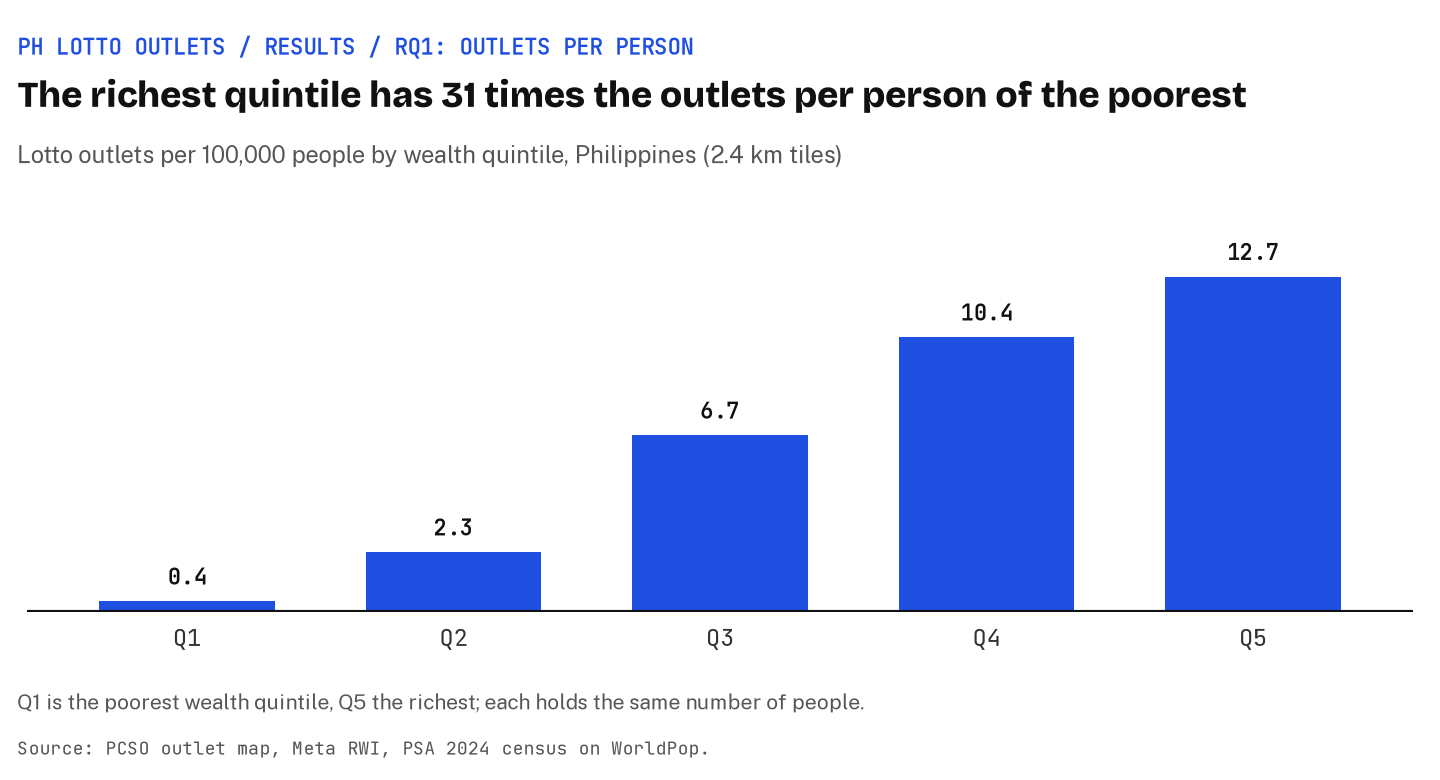
31xmore outlets per 100,000 people in the wealthiest quintile (12.7) than the poorest one (0.4)
11.5km vs 0.6kmmedian road distance to the nearest outlet, poorest against richest wealth quintile
2% vs 92%of people within 2 km of an outlet by road, poorest against richest wealth quintile
On access, the national picture is the reverse of "a tax on the poor": the poorest Filipinos have the fewest outlets and the furthest to go. 99.5% of people in the poorest wealth quintile live in a tile with no outlet, against 5.5% in the richest.
Outlets follow commerce, and that explains most of the rich-poor gap
0.19 vs 5.74shops per 1,000 people, poorest against richest wealth quintile; the urban share rises from 38% to 99.8%
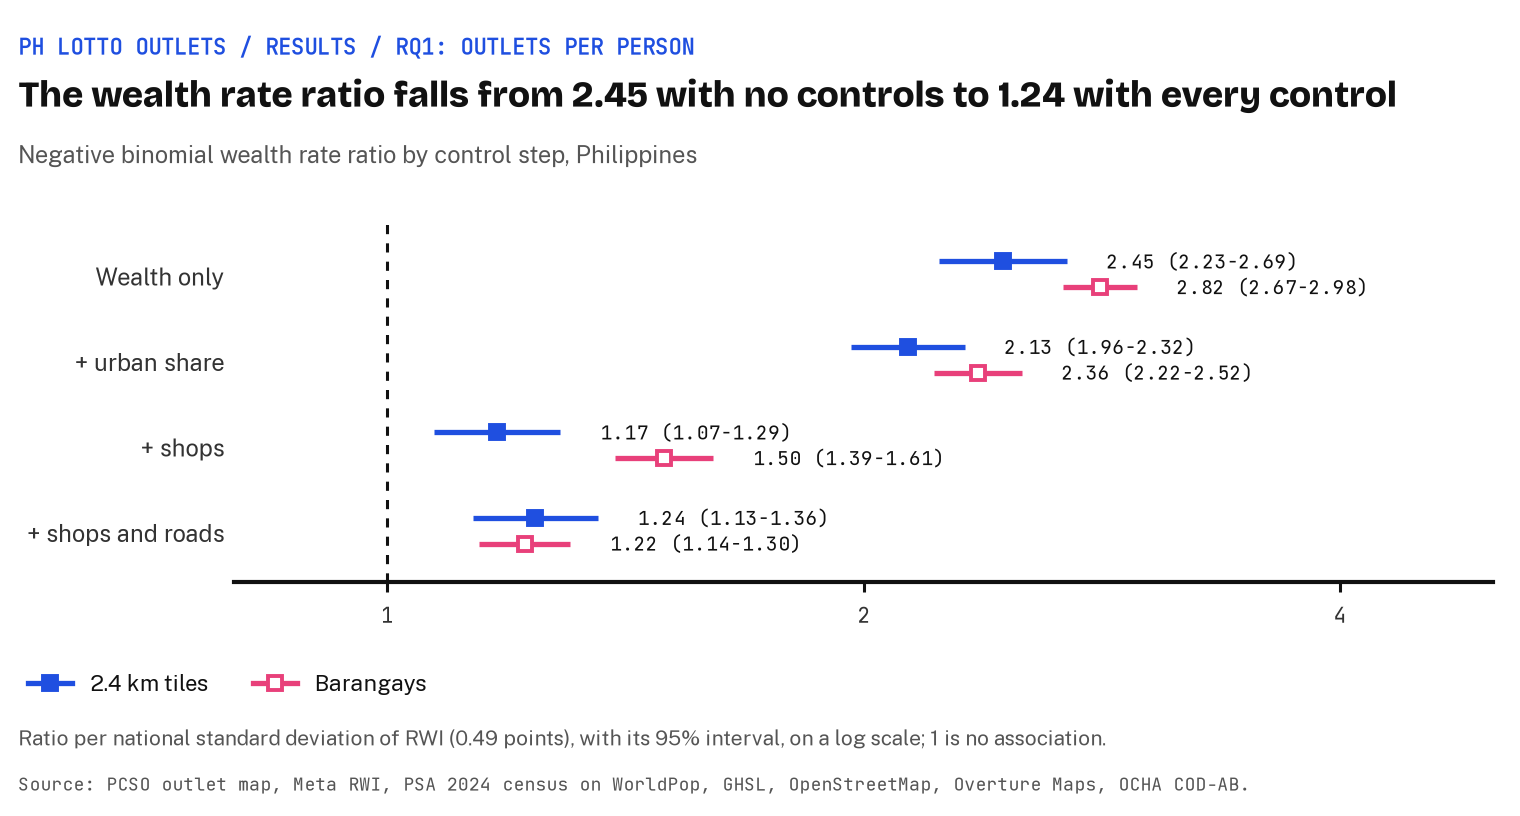
2.45 to 1.17the wealth rate ratio, with wealth only and then with urban share and shops held fixed
1.16 to 1.18the ratio with shops through the spatial refits and outlet sensitivities
A lotto terminal is a counter in a shop, a mall or a market, and in the Philippines shops cluster in towns, which are richer than the countryside around them. Most of the national gap is where shops and towns are: with urban share and shops held fixed, the wealth rate ratio falls from 2.45 to 1.17, a small lean towards richer places that holds through the spatial refits and outlet sensitivities (1.16 to 1.18). The ratio is how many times as many outlets per person a place one standard deviation richer has (0.49 RWI points); 1 means no difference.
12.5 to 15.2outlets per 100,000 people in every Metro Manila wealth quintile
99%of Metro Manila's people live within 2 km of the nearest lotto outlet
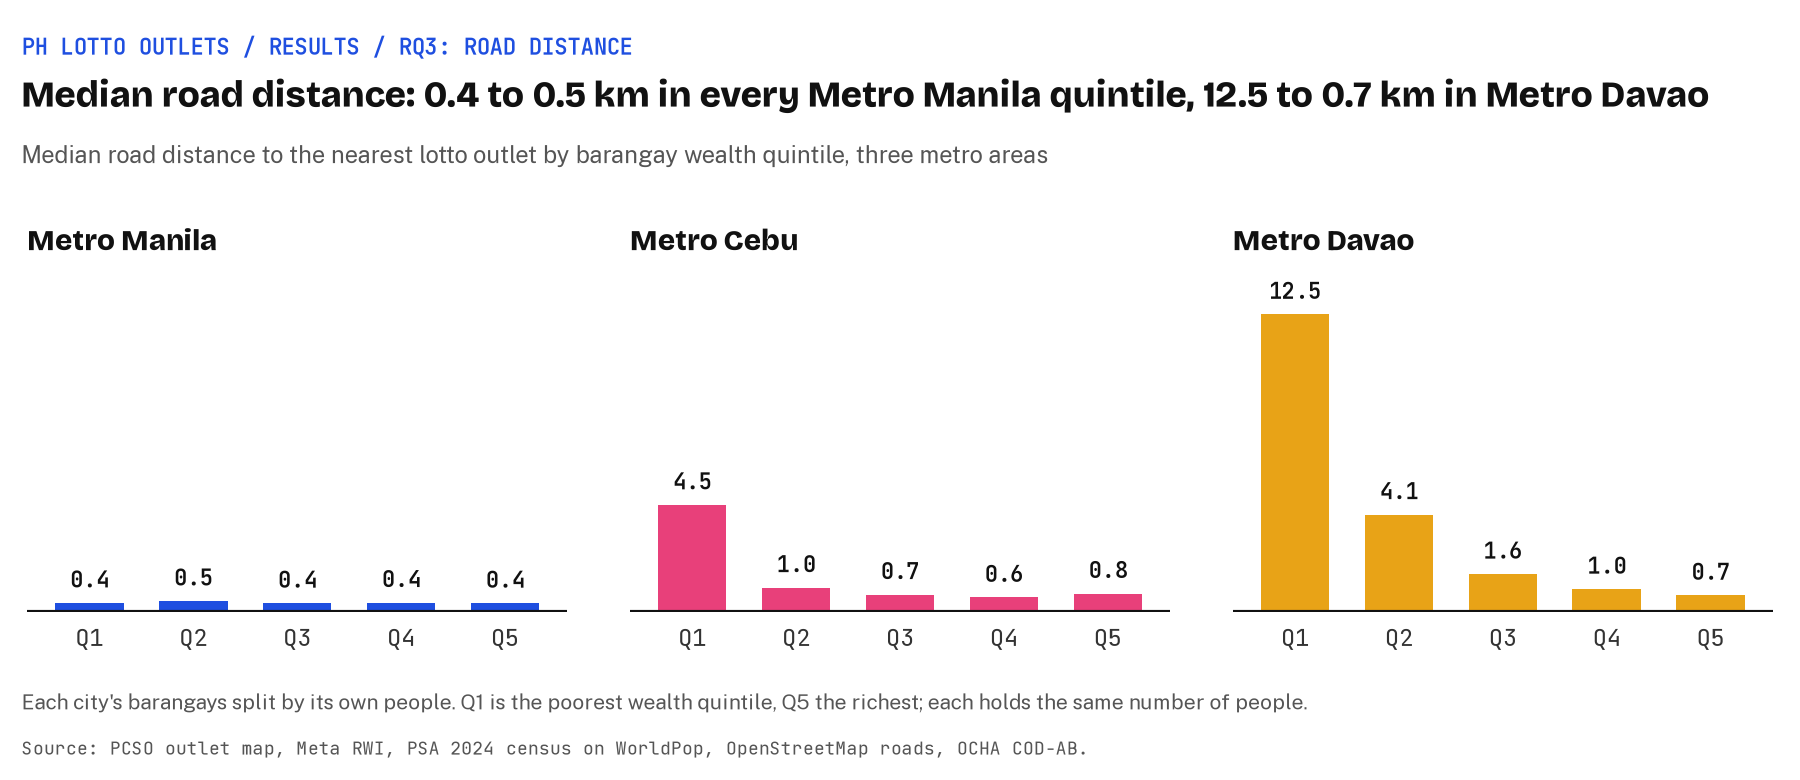
0.4 to 0.5 kmmedian road distance in every Metro Manila wealth quintile
However, Metro Manila paints a different picture: an outlet within about 400 m for everyone, whatever their wealth. Almost everyone lives in urban cells and every wealth quintile has 5.1 to 7.5 shops per 1,000 people, so outlets are close to everyone. Metro Davao repeats the national gradient (12.5 km by road in its poorest wealth quintile against 0.7 km in its richest), and Metro Cebu sits in between.
Figure 1 of the paper; select the map to open it full size. Source: barangays.csv.
The full design, every model and every check are in the paper.
Count outlets where wealth is measured. The main unit is the Relative Wealth Index's own 2.4 km tile (40,737 with people). Each barangay's 2024 census count is spread over the 100 m pixels where its people live. Barangays (41,923) are the check.
Compare per person. Outlets per 100,000 people by wealth quintile, then negative binomial count models with population as the offset and province intercepts.
Add commerce step by step. Wealth only, then urban share, shops (OpenStreetMap plus Overture) and road length, with spatial refits and outlet sensitivities as checks.
Zoom into three cities. The same models inside Metro Manila, Metro Cebu and Metro Davao by barangay, with errors clustered by tile.
Measure distance by road. From every 100 m pixel where people live to the nearest outlet over the OpenStreetMap road network.
Data
Every source is public and free to download.
Role
Source
Year
Outlets
PCSO "Lotto Outlets" map, 7,443 outlets
2026
Wealth
Meta / Data for Good Relative Wealth Index, 2.4 km tiles
Each is set out in full in the paper's limitations.
What it can't say
Access is not spending. Fewer outlets near poorer people does not mean poorer people buy fewer tickets: they may buy where they work, shop or travel.
Nothing here measures share of income. A PHP 20 play is a larger share of a small income wherever it is bought, so the spending claim stays open and needs household budget data.
Association, not cause. The ratios describe where outlets are relative to wealth, shops and towns; they do not say why PCSO and its agents put them there.
Lotto only. The Small Town Lottery brought in PHP 31.76 billion of PCSO's PHP 62.35 billion gaming revenue in 2024, and its booths are not published.
Outlets follow commerce, not poverty, so if the lottery is a tax on the poor in the Philippines, the case has to be made on spending, not on access.
What to hold loosely
The wealth index's own error is not carried through. Its per-tile error (mean 0.53) is large next to Metro Manila's barangay spread of 0.20, so intervals are too narrow and a flat result like Manila's is weaker evidence than it looks.
Shop coverage is uneven. 6.1 shops per 1,000 people in Metro Manila against 0.2 in BARMM, so the with-shops ratios rest on a control that is itself tied to wealth.
PCSO's list is undated. 7,443 outlets against 6,494 agents at the end of 2023, so it may hold closed outlets; dropping or adding doubtful ones moves the national ratios by 0.02 at most.
2.4 km tiles are coarse inside cities, and the layers come from different years: wealth from 2021, people from 2024, outlets, shops and roads from 2026.
BARMM is thin: 15 outlets for 5.7 million people and the weakest wealth coverage.
SOURCES /
Sources cited
Harris, J. The US Lottery is a Lie. YouTube, 8 March 2023. youtube.com
Berger, C. "America's poorest households spend 33 times more of their income on lottery tickets than the rich, data shows." Fortune, 4 April 2024. fortune.com
Inquirer. "7-Eleven operator celebrates 4,000-store milestone in PH." inquirer.net
Statista. "Number of Jollibee stores." statista.com
Batas Pambansa Blg. 42 (1979), amending RA 1169. lawphil.net
Republic Act No. 11223 (2019), Universal Health Care Act, Section 37(c). lawphil.net
Chi, G., Fang, H., Chatterjee, S. and Blumenstock, J. E. "Microestimates of wealth for all low- and middle-income countries." PNAS 119 (3), e2113658119, 2022. doi
Gotway, C. A. and Young, L. J. "Combining incompatible spatial data." Journal of the American Statistical Association 97 (458), 632-648, 2002. doi
Mennis, J. "Generating surface models of population using dasymetric mapping." The Professional Geographer 55 (1), 31-42, 2003. doi
Riebler, A., Sørbye, S. H., Simpson, D. and Rue, H. "An intuitive Bayesian spatial model for disease mapping that accounts for scaling." Statistical Methods in Medical Research, 2016. doi
JICA and Metro Cebu Development and Coordinating Board. The Roadmap Study for Sustainable Urban Development in Metro Cebu, final report, summary. June 2015. jica.go.jp